In a food swamp, convenience stores and fast food abound, but fresh fruits and vegetables are never found. Where are these food swamps in Gainesville, and who has to live in them?
A guest post by Rebekah Browne, University of Florida ’24, avid Free Grocery Store organizer and delivery driver.
Access to healthy food is a human right (FAO, n.d.) that is regularly violated (Montes, et al., 2019). Every meal, marginalized peoples face barriers – physical, financial, and sociocultural – to maintaining a diet they consider healthful. In the US and through domestic and global disruptions, Black and Hispanic communities have suffered disproportionate rates of food insecurity (John Hopkins University, 2021).
One barrier to accessing healthy food is spatial: our food environments. Neighborhoods, towns, and regions have stark differences in the food access options available within them. Food environments differ in two ways: spatial and financial accessibility, and quality of the food sold. We call areas with low spatial access to any food “food deserts”. We call areas with high access to poor quality food “food swamps”.
Not everyone is equally likely to live in a food desert or food swamp. They stand in stark contrast to the healthy food environments available to mostly white and privileged residents. Food deserts in Gainesville and their issues have been previously identified in a 2021 city report (Allen, 2022), but food swamps have not received the same attention.
Today we ask: where are these food swamps? And who must live in them?
Where are Gainesville’s food swamps?
To map food swamps, we first located food stores throughout Gainesville that accept SNAP (Supplement Nutrition Assistance Program, “Food Stamp”) benefits. These stores represent Gainesville’s (in theory) financially accessible food resources. Then, we classified the “healthy” food sources as stores which provide fresh produce (Figure 1).

The straight-line distance from a house to a store does not wholly describe a store’s physical accessibility; the road network must be considered for practical accuracy. The US Department of Agriculture (USDA) uses the one-mile straight-line distance between a house and a healthy food source to define food deserts (Berthomieux, 2017). Here, I conducted network analyses to draw food swamps. We define food swamps as areas at most one mile away by road from an unhealthy food source but over one mile away from a healthy food supplier (Figure 2).

To align the analysis with the association and relationship food swamps have with housing, we limited food swamps to residentially zoned parcels within Gainesville city limits, totaling 4.4 square miles of the original 15 square miles (Figure 3).
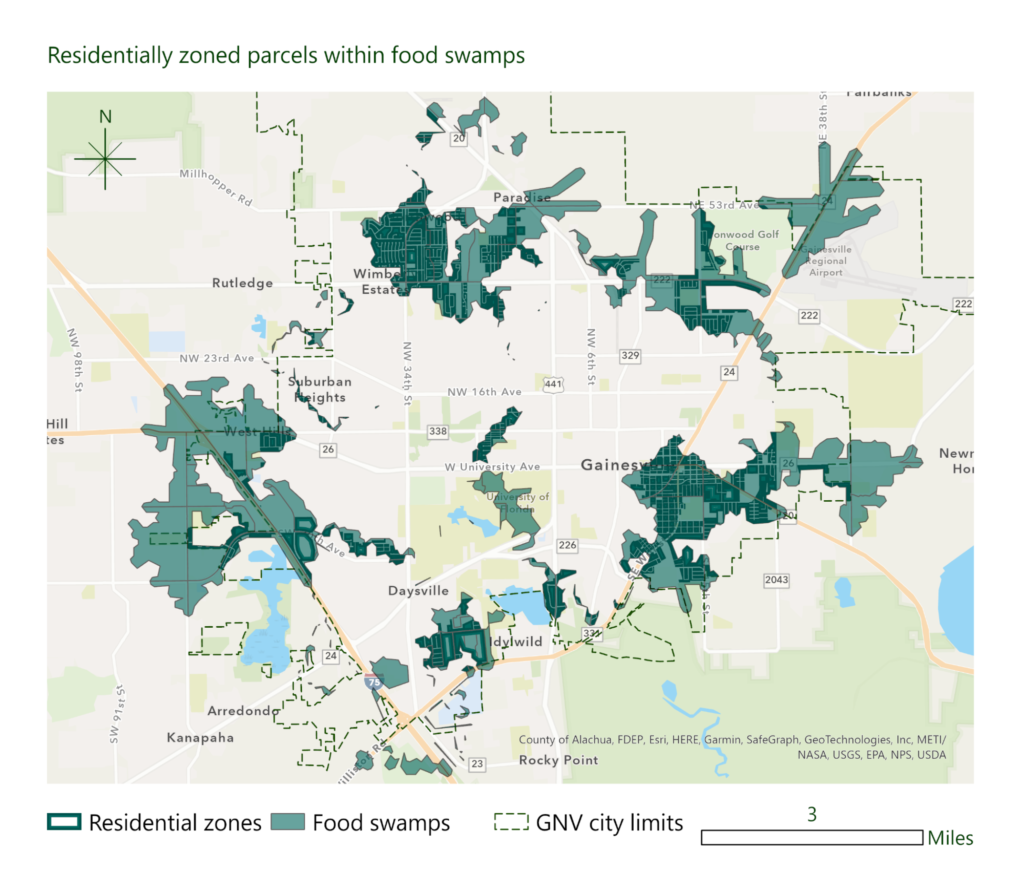
The food swamps mostly fall on the city’s edge, with the central food swamp resting north of UF campus, roughly in the Hibiscus Park, Palm Terrace, and University Park neighborhoods. To the north, a food swamp covered the Capri, Rainbows East, Springtree, Rainbow’s End, and Hazel Heights neighborhoods. In the southeast, a food swamp covered the Duval, North Lincoln Heights, Northeast Neighbors, Springhill, and Southeast Evergreen Trails neighborhoods (Figure 4). The Kirkwood and Phoenix neighborhoods are included in the two southernmost food swamps, and Highland Court Manor and Ironwood in the northeastern one.

Who lives in Gainesville’s food swamps?
To show the population makeup of Gainesville’s food swamps, we used block group-level demographic data from the US Census Bureau’s American Community Survey (ACS) 2021 results (U.S. Census Bureau, n.d.).
Stores that accepted SNAP, here representing affordable food stores, were used to map the food swamps, although most households across the food swamps were reported not to be receiving SNAP benefits from 2020-2021 (Figure 5).
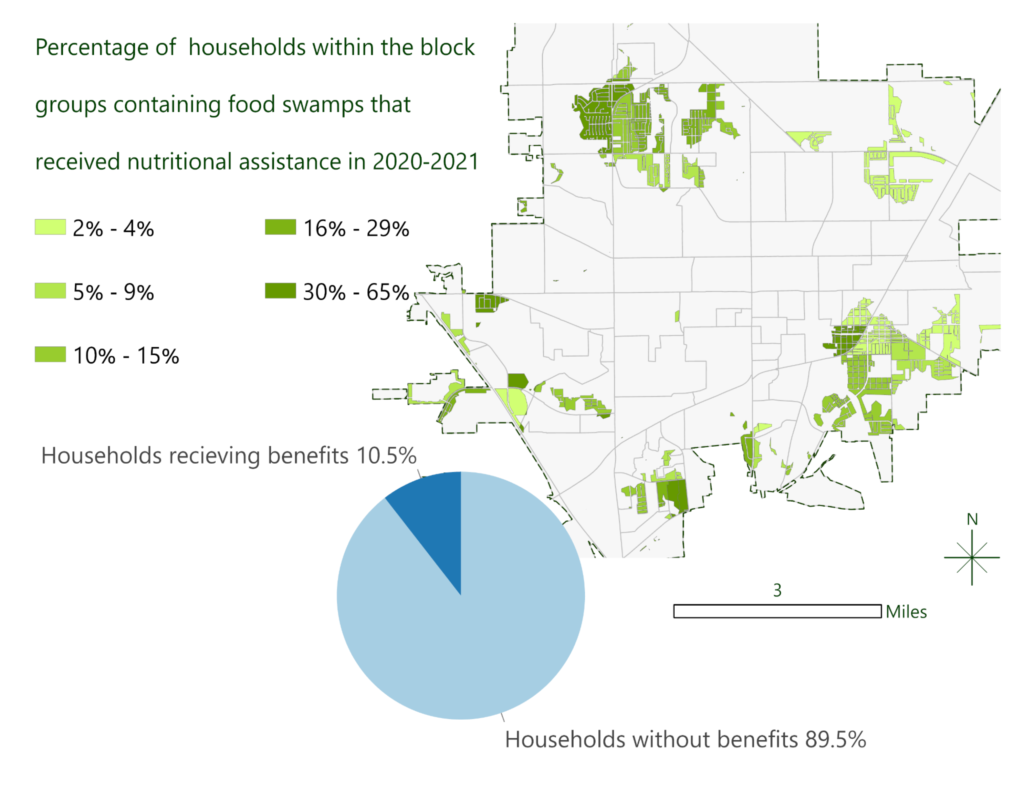
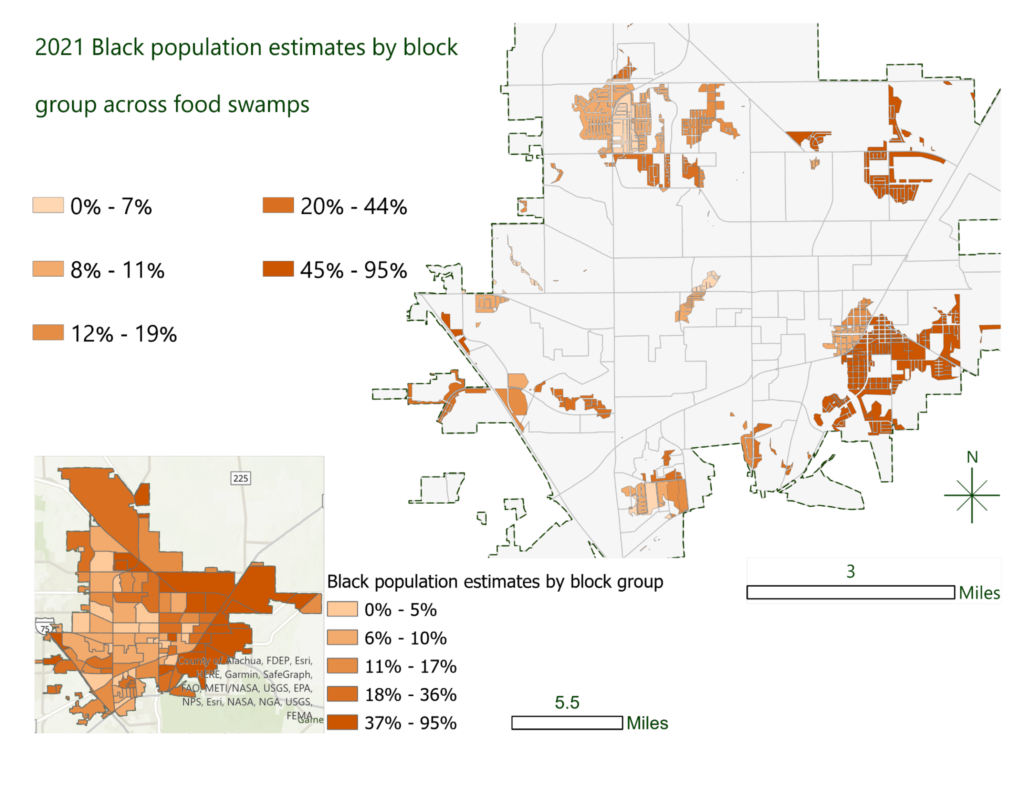
Even before looking at food swamps, Gainesville’s racial distribution is highly spatialized. The town’s Black population, 22% of the total population (U.S. Census Bureau, 2021a), live in neighborhoods in East Gainesville (Figure 6).
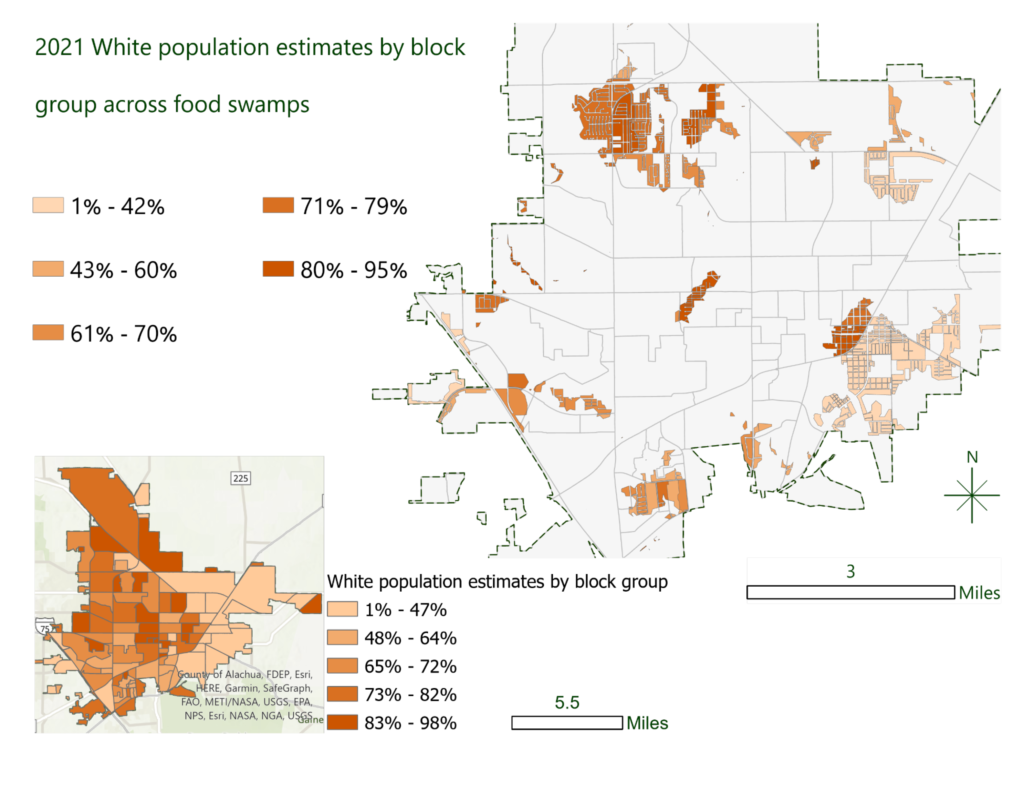
In contrast, Gainesville’s White population, 55% of the total population (U.S. Census Bureau, 2021a), is significantly underrepresented on the Eastside. The Northeast Neighbors neighborhood of the southeastern food swamp is an exception; interestingly enough, the neighborhood houses a higher number of households receiving nutritional assistance than the rest of the Eastside food swamp (Figure 7).
In East Gainesville, there is an immense overlap between Black communities and food swamps. 60% of people living in Gainesville’s food swamps are Black, while only 25% are White. Housing discrimination has historically restricted the investments made into Black communities (Butler, 2021); over time, structural discrimination established a correlation between racial and economic disparities (Inequality, n.d.).
The ACS measures economic status with the income to poverty level ratio, which compares a household’s annual income to an area’s specific poverty threshold that varies among homeowners and renters. Gainesville’s 2021 poverty thresholds were: $30,406 for homeowners with a mortgage; $25,823 for homeowners without a mortgage; and $30,734 for renters (U.S. Census Bureau, 2021b).
The northwestern food swamp is expansive despite its location around a White-majority sector of town. The south and southwestern food swamps did not drastically differ in the densities of Black and White populations, but are consistently 50% below the poverty line (Figure 8) to 25% above it (Figure 9). The southeastern food swamp also has a cluster of low-income communities.


What do we do about food swamps?
Gainesville’s marginalized communities face disproportionate rates of food insecurity. Although food swamps are dispersed across Gainesville, the largest ones were found to be neighborhoods of Black and low-income households. One contributor to this pattern is the lack of produce providers in East Gainesville compared to stores which do not provide fresh produce (Figure 1, above).
Imagine instead, these stores as points of access to healthy foods and fresh produce. The Food Trust’s Healthy Corner Store Initiative provides resources and training for store owners to profit from selling whole, unprocessed food options (The Food Trust, n.d.). Healthy Corner Stores have been associated with a decrease in the BMI of customers and an increase in healthier food intentions and cooking methods (Berthomieux, 2017).
Through a Healthy Corner Store Initiative, the concentration of gas stations and convenience stores around Eastside communities can be an opportunity to “ensure access to affordable, healthy, and culturally appropriate food to all residents” (Imagine GNV, 2021), a desired outcome in Gainesville’s 2030 Comprehensive Plan. In the plan, developing a healthy corner store program is listed as a strategy to eliminate food deserts.
While food swamps have less notoriety than food deserts, they present unique challenges and deserve specific interventions. They have a unique role in our food environments and show us the need for a healthy standard for accessible and affordable food options. Through healthy corner stores, choosing nutritional food becomes easier and not an inconvenience to the residents of Gainesville’s food swamps.
References
Allen, C. (May 23, 2022). “‘We’re the forgotten side of town’: Food deserts in East Gainesville.” The Alligator. www.alligator.org/article/2022/05/were-the-forgotten-side-of-town-food- deserts-in-east-gainesville.
Berthomieux, V. (2017). “Determining the need and feasibility of a healthy corner store intervention in Gainesville, FL.” https://ufdc.ufl.edu/UFE0051147/00001/pdf.
Butler, S. (June 22, 2021). “History of redlining helps explain present-day injustices in the housing market.” The Gainesville Sun. www.gainesville.com/story/opinion/2021/06/22/ sophia-butler-redlining-helps-explain-present-day-injustices-housing/7714985002.
Food and Agriculture Organization of the United Nations (FAO). (n.d.). “The right to food.” www.fao.org/right-to-food/background/en.
Gainesville Neighborhood Voices. (2008). “Neighborhoods.” www.gainesvilleneighborhoodsunited.org/neighborhoods.
Imagine GNV. (2021). “Our health and well being.” https://imaginegnv.konveio.com/ our-health-and-well-being?document=1.
Inequality.org. “Racial economic inequality.” https://inequality.org/facts/racial-inequality.
John Hopkins University. (Feb. 26, 2021). “Nearly half of Black and Hispanic people in the U.S. face food insecurity, new study finds.” Bloomberg School of Public Health. https://publichealth.jhu.edu/2021/nearly-half-of-black-and-hispanic-people-in-the-us-face-food-insecurity-new-study-finds.
Montes, D. C., Crawford, K., Dawson, L., and Herrera, R. (June 19, 2019). “Violations of the human right to food during Covid-19 in the United States.” University of Miami School of Law Human Rights Clinic. www.ohchr.org/sites/default/files/Documents/Issues/SexualOrientation/ IESOGI-COVID-19/academics/Miami-Law.pdf.
The Food Trust. (n.d.). “Healthy Corner Store Initiative.” https://thefoodtrust.org/ what-we-do/corner-stores.
U.S. Census Bureau. (2021a). American Community Survey 1-year estimates. Retrieved from Census Reporter Profile page for Gainesville, FL https://censusreporter.org/profiles/16000US1225175-gainesville-fl.
U.S. Census Bureau. (n.d.). “Glossary.” www.census.gov/programs-surveys/ geography/about/glossary.html
U.S. Census Bureau. (2021b). “Poverty Thresholds: 2021.” www.census.gov/data/tables/2021/ demo/supplemental-poverty-measure/poverty-thresholds.html.

Pingback:Gainesville community tackles Eastside food insecurity – The Independent Florida – Chefs News